Tri Pointe Homes, Inc. Reports 2022 Fourth Quarter and Record Full Year Results and Announces New Stock Repurchase Program
Fourth Quarter Highlights
-Diluted Earnings Per Share of $1.98, Up 49% Year-Over-Year- -New Home Deliveries of 2,016 for Home Sales Revenue of $1.5 Billion- -Homebuilding Gross Margin Percentage of 25.0%- -Pre-tax Margin of 18.0%- -Return on Average Equity of 22.5%*-
INCLINE VILLAGE, Nev., Feb. 21, 2023 (GLOBE NEWSWIRE) -- Tri Pointe Homes, Inc. (the “Company”) (NYSE: TPH) today announced results for the fourth quarter ended December 31, 2022 and full year 2022. The Company also announced that its Board of Directors has approved a new stock repurchase program authorizing the repurchase of up to $250 million of common stock through December 31, 2023 (the “Repurchase Program”).
“Tri Pointe Homes delivered another quarter of strong profitability for the fourth quarter of 2022, reporting all-time highs for quarterly home sales revenue of $1.5 billion, pre-tax income of $274 million, and diluted earnings per share of $1.98,” said Doug Bauer, Tri Pointe Homes Chief Executive Officer. “The strong finish to the year resulted in a record-breaking full year performance on both the top and bottom lines for the second consecutive year. For the full year, home sales revenue increased 9% to $4.3 billion, pre-tax income increased 24% to $773 million and diluted earnings per share increased 35% to $5.54.”
Mr. Bauer continued, “In addition to logistical challenges, our industry was also confronted with a challenging market in the back half of 2022, which found consumers facing a difficult home buying environment. In light of these circumstances, our team prioritized delivering our high margin homes in backlog and planning for success in 2023. This included analyzing price positioning and product offerings at both existing and future communities, as well as driving cost savings to produce more affordable price points. These strategies have already shown positive results in the early part of 2023. For the month of January, net new home orders were 421 with an absorption rate of 3.1 per community. To date in February, we have seen similarly strong results with absorption rates of approximately 4.0 net new home orders per community.”
Mr. Bauer concluded, “We ended 2022 in a strong cash position and intend to use that capital to fund community count growth in 2023, which we anticipate will lead to more scale in each of our markets and drive better leverage and returns. We are encouraged by the early sales success we are seeing this year, while recognizing that this positive momentum could be impacted by further interest rate increases and the possibility of a recession. Long term, we remain extremely positive on the outlook for housing due to the lack of supply and favorable buyer demographics, and we feel Tri Pointe is in a strong position to capitalize on these factors.”
Results and Operational Data for Fourth Quarter 2022 and Comparisons to Fourth Quarter 2021
Net income available to common stockholders was $203.0 million, or $1.98 per diluted share, compared to $147.4 million, or $1.33 per diluted share
Home sales revenue for the quarter was $1.5 billion, an increase of 25%
New home deliveries of 2,016 homes compared to 1,885 homes, an increase of 7%
Average sales price of homes delivered of $746,000 compared to $637,000
Homebuilding gross margin percentage of 25.0% compared to 24.4%, an increase of 60 basis points
Excluding interest, impairments and lot option abandonments, adjusted homebuilding gross margin percentage was 27.9%**
Selling, general and administrative (“SG&A”) expense as a percentage of homes sales revenue of 7.6% compared to 8.5%, a decrease of 90 basis points
Net new home orders of 444 compared to 1,424, a decrease of 69%
Active selling communities averaged 136.8 compared to 110.5, an increase of 24%
Net new home orders per average selling community decreased by 74% to 3.2 orders (1.1 monthly) compared to 12.9 orders (4.3 monthly)
Cancellation rate of 42% compared to 9%
Backlog units at quarter end of 1,472 homes compared to 3,158, a decrease of 53%
Dollar value of backlog at quarter end of $1.2 billion compared to $2.2 billion, a decrease of 48%
Average sales price in backlog at quarter end of $791,000 compared to $710,000, an increase of 11%
Ratios of debt-to-capital and net debt-to-net capital of 32.7% and 14.7%**, respectively, as of December 31, 2022
Ended fourth quarter of 2022 with total liquidity of $1.6 billion, including cash of $889.7 million and $691.1 million of availability under the Company’s unsecured revolving credit facility
* Return on average equity is calculated as net income available to common stockholders for the trailing twelve months divided by average stockholders’ equity for the trailing five quarters
** See “Reconciliation of Non-GAAP Financial Measures”
Results and Operational Data for Full Year 2022 and Comparisons to Full Year 2021
Net income available to common stockholders was $576.1 million, or $5.54 per diluted share, compared to $469.3 million, or $4.12 per diluted share
Home sales revenue of $4.3 billion compared to $4.0 billion, an increase of 9%
New home deliveries of 6,063 homes compared to 6,188 homes, a decrease of 2%
Average sales price of homes delivered of $708,000 compared to $639,000, an increase of 11%
Homebuilding gross margin percentage of 26.4% compared to 24.9%, an increase of 150 basis points
Excluding interest, impairments and lot option abandonments, adjusted homebuilding gross margin percentage was 29.0%**
SG&A expense as a percentage of homes sales revenue of 9.0% compared to 9.6%, a decrease of 60 basis points
Net new home orders of 4,377 compared to 6,382, a decrease of 31%
Active selling communities averaged 124.7 compared to 111.8, an increase of 12%
Net new home orders per average selling community decreased by 40% to 35.1 orders (2.9 monthly) compared to 57.1 orders (4.8 monthly)
Cancellation rate of 19% compared to 8%
Repurchased 9,396,381 shares of common stock at an average price of $21.57 for an aggregate dollar amount of $202.6 million in the full year ended December 31, 2022
** See “Reconciliation of Non-GAAP Financial Measures”
“Our aim is to optimize our business to current market conditions while taking advantage of our strong land pipeline to grow volume over time. We have implemented initiatives designed to improve absorptions, realign our cost structure, and maximize profitability and return on equity,” said Tri Pointe Homes President and Chief Operating Officer Tom Mitchell. “Our operating teams have been hard at work obtaining lower costs at all of our projects with a goal of 10% to 20% in cost reductions by the end of 2023. Additionally, we are focused on improving cycle times to accelerate inventory turns and increase our delivery volume. While average cycle times have increased compared to pre-pandemic levels, our goal is to reduce cycle times by an average of four to six weeks by year end.”
Outlook
For the first quarter of 2023, the Company anticipates delivering between 750 and 850 homes at an average sales price between $720,000 and $730,000. The Company expects its homebuilding gross margin percentage to be in the range of 23.0% to 24.0% for the first quarter of 2023 and anticipates its SG&A expense as a percentage of home sales revenue will be in the range of 14.0% to 14.5%. Lastly, the Company expects its effective tax rate for the first quarter of 2023 to be in the range of 26.0% to 27.0%.
Stock Repurchase Program
On February 15, 2023, our Board of Directors approved the Repurchase Program, which authorizes the repurchase of up to $250 million of Company common stock through December 31, 2023. Purchases of common stock pursuant to the Repurchase Program may be made in open market transactions effected through a broker-dealer at prevailing market prices, in block trades, or by other means in accordance with federal securities laws, including pursuant to any trading plan that may be adopted in accordance with Rule 10b5-1 under the Securities Exchange Act of 1934, as amended. The Company is not obligated under the Repurchase Program to repurchase any specific number or dollar amount of shares of common stock, and it may modify, suspend or discontinue the Repurchase Program at any time. Company management will determine the timing and amount of any repurchases in its discretion based on a variety of factors, such as the market price of the Company’s common stock, corporate requirements, general market economic conditions, legal requirements and applicable tax effects.
Earnings Conference Call
The Company will host a conference call via live webcast for investors and other interested parties beginning at 7:00 a.m. Pacific Time (10:00 a.m. Eastern Time) on Tuesday, February 21, 2023. The call will be hosted by Doug Bauer, Chief Executive Officer, Tom Mitchell, President and Chief Operating Officer, Glenn Keeler, Chief Financial Officer, and Linda Mamet, Chief Marketing Officer.
Interested parties can listen to the call live and view the related presentation slides on the internet through the Events & Presentations heading in the Investors section of the Company’s website at www.TriPointeHomes.com. Listeners should go to the website at least fifteen minutes prior to the call to download and install any necessary audio software. The call can also be accessed toll free at (877) 407-3982, or (201) 493-6780 for international participants. Participants should ask for the Tri Pointe Homes Fourth Quarter 2022 Earnings Conference Call. Those dialing in should do so at least ten minutes prior to the start of the call. A replay of the call will be available for one week following the call toll free at (844) 512-2921, or (412) 317-6671 for international participants, using the reference number 13735368. An archive of the webcast will also be available on the Company’s website for a limited time.
About Tri Pointe Homes®
One of the largest homebuilders in the U.S., Tri Pointe Homes, Inc. (NYSE: TPH) is a publicly traded company and a recognized leader in customer experience, innovative design, and environmentally responsible business practices. The company builds premium homes and communities in 10 states, with deep ties to the communities it serves—some for as long as a century. Tri Pointe Homes combines the financial resources, technology platforms, and proven leadership of a national organization with the regional insights, longstanding community connections, and agility of empowered local teams. Tri Pointe has won multiple Builder of the Year awards, most recently in 2019. The company made Fortune magazine’s 2017 100 Fastest-Growing Companies list, was named as a Great Place to Work-Certified™ company in both 2021 and 2022, and was named on several Great Place to Work® Best Workplaces lists in 2022. For more information, please visit TriPointeHomes.com.
Forward-Looking Statements
Various statements contained in this press release, including those that express a belief, expectation or intention, as well as those that are not statements of historical fact, are forward-looking statements. These forward-looking statements may include, but are not limited to, statements regarding our strategy, projections and estimates concerning the timing and success of specific projects and our future production, land and lot sales, operational and financial results, including our estimates for growth, financial condition, sales prices, prospects, and capital spending. Forward-looking statements that are included in this press release are generally accompanied by words such as “anticipate,” “believe,” “could,” “estimate,” “expect,” “future,” “goal,” “guidance,” “intend,” “likely,” “may,” “might,” “outlook,” “plan,” “potential,” “predict,” “project,” “should,” “strategy,” “target,” “will,” “would,” or other words that convey future events or outcomes. The forward-looking statements in this press release speak only as of the date of this press release, and we disclaim any obligation to update these statements unless required by law, and we caution you not to rely on them unduly. These forward-looking statements are inherently subject to significant business, economic, competitive, regulatory and other risks, contingencies and uncertainties, most of which are difficult to predict and many of which are beyond our control. The following factors, among others, may cause our actual results, performance or achievements to differ materially from any future results, performance or achievements expressed or implied by these forward-looking statements: the effects of general economic conditions, including employment rates, housing starts, interest rate levels, availability of financing for home mortgages and strength of the U.S. dollar; market demand for our products, which is related to the strength of the various U.S. business segments and U.S. and international economic conditions; the availability of desirable and reasonably priced land and our ability to control, purchase, hold and develop such parcels; access to adequate capital on acceptable terms; geographic concentration of our operations, particularly within California; levels of competition; the successful execution of our internal performance plans, including restructuring and cost reduction initiatives; the prices and availability of supply chain inputs, including raw materials and labor; oil and other energy prices; the effects of U.S. trade policies, including the imposition of tariffs and duties on homebuilding products and retaliatory measures taken by other countries; the effects of weather, including the occurrence of drought conditions in California; the risk of loss from earthquakes, volcanoes, fires, floods, droughts, windstorms, hurricanes, pest infestations and other natural disasters, and the risk of delays, reduced consumer demand, and shortages and price increases in labor or materials associated with such natural disasters; the risk of loss from acts of war, terrorism, civil unrest or public health emergencies, including outbreaks of contagious diseases, such as COVID-19; transportation costs; federal and state tax policies; the effects of land use, environment and other governmental laws and regulations; legal proceedings or disputes and the adequacy of reserves; risks relating to any unforeseen changes to or effects on liabilities, future capital expenditures, revenues, expenses, earnings, synergies, indebtedness, financial condition, losses and future prospects; changes in accounting principles; risks related to unauthorized access to our computer systems, theft of our homebuyers’ confidential information or other forms of cyber-attack; and additional factors discussed under the sections captioned “Risk Factors” included in our annual and quarterly reports filed with the Securities and Exchange Commission. The foregoing list is not exhaustive. New risk factors may emerge from time to time and it is not possible for management to predict all such risk factors or to assess the impact of such risk factors on our business.
| Investor Relations Contact: | Media Contact: |
| InvestorRelations@TriPointeHomes.com, 949-478-8696 | Carol Ruiz, cruiz@newgroundco.com, 310-437-0045 |
KEY OPERATIONS AND FINANCIAL DATA (dollars in thousands) (unaudited)
| Three Months Ended December 31, | Year Ended December 31, | |||||||
| 2022 | 2021 | Change | % Change | 2022 | 2021 | Change | % Change | |
| Operating Data: | ||||||||
| Home sales revenue | $1,504,177 | $1,200,222 | $303,955 | 25% | $4,291,563 | $3,955,154 | $336,409 | 9% |
| Homebuilding gross margin | $376,756 | $292,580 | $84,176 | 29% | $1,130,982 | $982,917 | $148,065 | 15% |
| Homebuilding gross margin % | 25.0% | 24.4% | 0.6% | 26.4% | 24.9% | 1.5% | ||
| Adjusted homebuilding gross margin %* | 27.9% | 28.1% | (0.2)% | 29.0% | 27.9% | 1.1% | ||
| SG&A expense | $114,726 | $102,451 | $12,275 | 12% | $387,509 | $379,377 | $8,132 | 2% |
| SG&A expense as a % of home sales revenue | 7.6% | 8.5% | (0.9)% | 9.0% | 9.6% | (0.6)% | ||
| Net income available to common stockholders | $202,973 | $147,440 | $55,533 | 38% | $576,060 | $469,267 | $106,793 | 23% |
| Adjusted EBITDA* | $324,716 | $257,365 | $67,351 | 26% | $929,081 | $801,340 | $127,741 | 16% |
| Interest incurred | $35,294 | $24,766 | $10,528 | 43% | $124,529 | $92,783 | $31,746 | 34% |
| Interest in cost of home sales | $38,036 | $23,991 | $14,045 | 59% | $106,595 | $101,176 | $5,419 | 5% |
| Other Data: | ||||||||
| Net new home orders | 444 | 1,424 | (980) | (69)% | 4,377 | 6,382 | (2,005) | (31)% |
| New homes delivered | 2,016 | 1,885 | 131 | 7% | 6,063 | 6,188 | (125) | (2)% |
| Average sales price of homes delivered | $746 | $637 | $109 | 17% | $708 | $639 | $69 | 11% |
| Cancellation rate | 42% | 9% | 33% | 19% | 8% | 11% | ||
| Average selling communities | 136.8 | 110.5 | 26.3 | 24% | 124.7 | 111.8 | 12.9 | 12% |
| Selling communities at end of period | 136 | 112 | 24 | 21% | ||||
| Backlog (estimated dollar value) | $1,164,678 | $2,242,159 | $(1,077,481) | (48)% | ||||
| Backlog (homes) | 1,472 | 3,158 | (1,686) | (53)% | ||||
| Average sales price in backlog | $791 | $710 | $81 | 11% | ||||
| December 31, 2022 | December 31, 2021 | Change | ||||||
| Balance Sheet Data: | ||||||||
| Cash and cash equivalents | $889,664 | $681,528 | $208,136 | |||||
| Real estate inventories | $3,173,849 | $3,054,743 | $119,106 | |||||
| Lots owned or controlled | 33,794 | 41,675 | (7,881) | |||||
| Homes under construction (1) | 2,373 | 3,632 | (1,259) | |||||
| Homes completed, unsold | 288 | 27 | 261 | |||||
| Total debt, net | $1,378,051 | $1,337,723 | $40,328 | |||||
| Stockholders' equity | $2,832,389 | $2,447,621 | $384,768 | |||||
| Book capitalization | $4,210,440 | $3,785,344 | $425,096 | |||||
| Ratio of debt-to-capital | 32.7% | 35.3% | (2.6)% | |||||
| Ratio of net debt-to-net-capital* | 14.7% | 21.1% | (6.4)% | |||||
_____________________________________ (1) Homes under construction included 78 and 85 models at December 31, 2022 and December 31, 2021, respectively. * See “Reconciliation of Non-GAAP Financial Measures”
CONSOLIDATED BALANCE SHEETS (in thousands, except share amounts)
| December 31, 2022 | December 31, 2021 | |
| Assets | (unaudited) | |
| Cash and cash equivalents | $889,664 | $681,528 |
| Receivables | 169,449 | 116,996 |
| Real estate inventories | 3,173,849 | 3,054,743 |
| Investments in unconsolidated entities | 129,837 | 118,095 |
| Goodwill and other intangible assets, net | 156,603 | 156,603 |
| Deferred tax assets, net | 34,851 | 57,096 |
| Other assets | 165,687 | 151,162 |
| Total assets | $4,719,940 | $4,336,223 |
| Liabilities | ||
| Accounts payable | $62,324 | $84,854 |
| Accrued expenses and other liabilities | 443,034 | 466,013 |
| Loans payable | 287,427 | 250,504 |
| Senior notes | 1,090,624 | 1,087,219 |
| Total liabilities | 1,883,409 | 1,888,590 |
| Commitments and contingencies | ||
| Equity | ||
| Stockholders' Equity: | ||
| Preferred stock, $0.01 par value, 50,000,000 shares authorized; no shares issued and outstanding as of December 31, 2022 and December 31, 2021, respectively | — | — |
| Common stock, $0.01 par value, 500,000,000 shares authorized; 101,017,708 and 109,644,474 shares issued and outstanding at December 31, 2022 and December 31, 2021, respectively | 1,010 | 1,096 |
| Additional paid-in capital | 3,685 | 91,077 |
| Retained earnings | 2,827,694 | 2,355,448 |
| Total stockholders' equity | 2,832,389 | 2,447,621 |
| Noncontrolling interests | 4,142 | 12 |
| Total equity | 2,836,531 | 2,447,633 |
| Total liabilities and equity | $4,719,940 | $4,336,223 |
CONSOLIDATED STATEMENT OF OPERATIONS (in thousands, except share and per share amounts) (unaudited)
| Three Months Ended December 31, | Year Ended December 31, | |||
| 2022 | 2021 | 2022 | 2021 | |
| Homebuilding: | ||||
| Home sales revenue | $1,504,177 | $1,200,222 | $4,291,563 | $3,955,154 |
| Land and lot sales revenue | 771 | 5,496 | 5,108 | 13,016 |
| Other operations revenue | 674 | 650 | 2,695 | 2,619 |
| Total revenues | 1,505,622 | 1,206,368 | 4,299,366 | 3,970,789 |
| Cost of home sales | 1,127,421 | 907,642 | 3,160,581 | 2,972,237 |
| Cost of land and lot sales | — | 5,667 | 2,075 | 11,585 |
| Other operations expense | 665 | 439 | 2,685 | 2,550 |
| Sales and marketing | 62,293 | 48,390 | 175,005 | 179,214 |
| General and administrative | 52,433 | 54,061 | 212,504 | 200,163 |
| Homebuilding income from operations | 262,810 | 190,169 | 746,516 | 605,040 |
| Equity in income (loss) of unconsolidated entities | 346 | (24) | 312 | (96) |
| Other income, net | 1,455 | 97 | 2,307 | 525 |
| Homebuilding income before income taxes | 264,611 | 190,242 | 749,135 | 605,469 |
| Financial Services: | ||||
| Revenues | 17,182 | 3,644 | 49,167 | 11,446 |
| Expenses | 7,679 | 1,782 | 25,136 | 6,292 |
| Equity in income of unconsolidated entities | — | 4,453 | 46 | 15,039 |
| Financial services income before income taxes | 9,503 | 6,315 | 24,077 | 20,193 |
| Income before income taxes | 274,114 | 196,557 | 773,212 | 625,662 |
| Provision for income taxes | (68,719) | (49,117) | (190,803) | (156,395) |
| Net income | 205,395 | 147,440 | 582,409 | 469,267 |
| Net income attributable to noncontrolling interests | (2,422) | — | (6,349) | — |
| Net income available to common stockholders | $202,973 | $147,440 | $576,060 | $469,267 |
| Earnings per share | ||||
| Basic | $2.01 | $1.34 | $5.60 | $4.16 |
| Diluted | $1.98 | $1.33 | $5.54 | $4.12 |
| Weighted average shares outstanding | ||||
| Basic | 100,947,993 | 109,911,768 | 102,898,423 | 112,836,051 |
| Diluted | 102,456,279 | 111,126,846 | 104,003,652 | 113,809,292 |
MARKET DATA BY REPORTING SEGMENT & STATE (dollars in thousands) (unaudited)
| Three Months Ended December 31, | Year Ended December 31, | |||||||
| 2022 | 2021 | 2022 | 2021 | |||||
| New Homes Delivered | Average Sales Price | New Homes Delivered | Average Sales Price | New Homes Delivered | Average Sales Price | New Homes Delivered | Average Sales Price | |
| Arizona | 266 | $774 | 218 | $703 | 629 | $761 | 788 | $677 |
| California | 812 | 820 | 745 | 639 | 2,541 | 751 | 2,608 | 664 |
| Nevada | 159 | 796 | 146 | 718 | 522 | 751 | 527 | 637 |
| Washington | 36 | 888 | 73 | 989 | 208 | 962 | 296 | 986 |
| West total | 1,273 | 809 | 1,182 | 682 | 3,900 | 764 | 4,219 | 686 |
| Colorado | 121 | 745 | 77 | 650 | 322 | 716 | 231 | 606 |
| Texas | 338 | 614 | 360 | 509 | 1,126 | 553 | 1,081 | 491 |
| Central total | 459 | 649 | 437 | 534 | 1,448 | 590 | 1,312 | 512 |
| Carolinas(1) | 194 | 468 | 50 | 429 | 346 | 466 | 114 | 403 |
| Washington D.C. Area(2) | 90 | 951 | 216 | 643 | 369 | 808 | 543 | 634 |
| East total | 284 | 621 | 266 | 603 | 715 | 642 | 657 | 594 |
| Total | 2,016 | $746 | 1,885 | $637 | 6,063 | $708 | 6,188 | $639 |
| Three Months Ended December 31, | Year Ended December 31, | |||||||
| 2022 | 2021 | 2022 | 2021 | |||||
| Net New Home Orders | Average Selling Communities | Net New Home Orders | Average Selling Communities | Net New Home Orders | Average Selling Communities | Net New Home Orders | Average Selling Communities | |
| Arizona | 3 | 13.0 | 153 | 11.7 | 487 | 13.4 | 829 | 13.8 |
| California | 226 | 55.5 | 521 | 40.0 | 1,803 | 49.3 | 2,386 | 39.2 |
| Nevada | 4 | 6.8 | 149 | 10.0 | 321 | 7.5 | 717 | 10.9 |
| Washington | 11 | 5.0 | 57 | 5.8 | 114 | 3.3 | 286 | 5.7 |
| West total | 244 | 80.3 | 880 | 67.5 | 2,725 | 73.5 | 4,218 | 69.6 |
| Colorado | 8 | 6.5 | 71 | 7.8 | 188 | 7.4 | 289 | 6.2 |
| Texas | 81 | 30.0 | 274 | 21.7 | 772 | 24.8 | 1,219 | 22.3 |
| Central total | 89 | 36.5 | 345 | 29.5 | 960 | 32.2 | 1,508 | 28.5 |
| Carolinas(1) | 73 | 15.2 | 91 | 4.7 | 445 | 12.2 | 220 | 3.5 |
| Washington D.C. Area(2) | 38 | 4.8 | 108 | 8.8 | 247 | 6.8 | 436 | 10.2 |
| East total | 111 | 20.0 | 199 | 13.5 | 692 | 19.0 | 656 | 13.7 |
| Total | 444 | 136.8 | 1,424 | 110.5 | 4,377 | 124.7 | 6,382 | 111.8 |
MARKET DATA BY REPORTING SEGMENT & STATE, continued (dollars in thousands) (unaudited)
| As of December 31, 2022 | As of December 31, 2021 | |||||
| Backlog Units | Backlog Dollar Value | Average Sales Price | Backlog Units | Backlog Dollar Value | Average Sales Price | |
| Arizona | 378 | $316,233 | $837 | 520 | $401,257 | $772 |
| California | 298 | 289,659 | 972 | 1,036 | 774,901 | 748 |
| Nevada | 125 | 102,985 | 824 | 326 | 237,712 | 729 |
| Washington | 35 | 27,075 | 774 | 129 | 133,317 | 1,033 |
| West total | 836 | 735,952 | 880 | 2,011 | 1,547,187 | 769 |
| Colorado | 50 | 39,988 | 800 | 184 | 134,831 | 733 |
| Texas | 282 | 186,001 | 660 | 636 | 337,232 | 530 |
| Central total | 332 | 225,989 | 681 | 820 | 472,063 | 576 |
| Carolinas(1) | 220 | 102,775 | 467 | 121 | 55,205 | 456 |
| Washington D.C. Area(2) | 84 | 99,962 | 1,190 | 206 | 167,704 | 814 |
| East total | 304 | 202,737 | 667 | 327 | 222,909 | 682 |
| Total | 1,472 | $1,164,678 | $791 | 3,158 | $2,242,159 | $710 |
| December 31, 2022 | December 31, 2021 | |||||
| Lots Owned or Controlled: | ||||||
| Arizona | 2,901 | 4,607 | ||||
| California | 11,399 | 15,091 | ||||
| Nevada | 1,634 | 2,161 | ||||
| Washington | 827 | 1,010 | ||||
| West total | 16,761 | 22,869 | ||||
| Colorado | 1,600 | 1,683 | ||||
| Texas | 10,361 | 12,297 | ||||
| Central total | 11,961 | 13,980 | ||||
| Carolinas(1) | 3,857 | 3,458 | ||||
| Washington D.C. Area(2) | 1,215 | 1,368 | ||||
| East total | 5,072 | 4,826 | ||||
| Total | 33,794 | 41,675 | ||||
| December 31, 2022 | December 31, 2021 | |||||
| Lots by Ownership Type: | ||||||
| Lots owned | 18,762 | 22,136 | ||||
| Lots controlled (1) | 15,032 | 19,539 | ||||
| Total | 33,794 | 41,675 | ||||
__________ (1) As of December 31, 2022 and 2021, lots controlled included lots that were under land option contracts or purchase contracts. As of December 31, 2022 and 2021, lots controlled for Central include 3,325 and 2,950 lots, respectively, and lots controlled for East include 141 and 179 lots, respectively, which represent our expected share of lots owned by our investments in unconsolidated land development joint ventures.
RECONCILIATION OF NON-GAAP FINANCIAL MEASURES (unaudited)
In this press release, we utilize certain financial measures that are non-GAAP financial measures as defined by the Securities and Exchange Commission. We present these measures because we believe they and similar measures are useful to management and investors in evaluating the Company’s operating performance and financing structure. We also believe these measures facilitate the comparison of our operating performance and financing structure with other companies in our industry. Because these measures are not calculated in accordance with Generally Accepted Accounting Principles (“GAAP”), they may not be comparable to other similarly titled measures of other companies and should not be considered in isolation or as a substitute for, or superior to, financial measures prepared in accordance with GAAP.
The following tables reconcile homebuilding gross margin percentage, as reported and prepared in accordance with GAAP, to the non-GAAP financial measure adjusted homebuilding gross margin percentage. We believe this information is meaningful as it isolates the impact that leverage and non-cash impairments and lot option abandonments, as applicable, have on homebuilding gross margin and permits investors to make better comparisons with our competitors, who may adjust gross margins in a similar fashion.
| Three Months Ended December 31, | ||||
| 2022 | % | 2021 | % | |
| (dollars in thousands) | ||||
| Home sales revenue | $1,504,177 | 100.0% | $1,200,222 | 100.0% |
| Cost of home sales | 1,127,421 | 75.0% | 907,642 | 75.6% |
| Homebuilding gross margin | 376,756 | 25.0% | 292,580 | 24.4% |
| Add: interest in cost of home sales | 38,036 | 2.5% | 23,991 | 2.0% |
| Add: impairments and lot option abandonments | 4,252 | 0.3% | 20,125 | 1.7% |
| Adjusted homebuilding gross margin | $419,044 | 27.9% | $336,696 | 28.1% |
| Homebuilding gross margin percentage | 25.0% | 24.4% | ||
| Adjusted homebuilding gross margin percentage | 27.9% | 28.1% | ||
| Year Ended December 31, | ||||
| 2022 | % | 2021 | % | |
| (dollars in thousands) | ||||
| Home sales revenue | $4,291,563 | 100.0% | $3,955,154 | 100.0% |
| Cost of home sales | 3,160,581 | 73.6% | 2,972,237 | 75.1% |
| Homebuilding gross margin | 1,130,982 | 26.4% | 982,917 | 24.9% |
| Add: interest in cost of home sales | 106,595 | 2.5% | 101,176 | 2.6% |
| Add: impairments and lot option abandonments | 8,747 | 0.2% | 20,838 | 0.5% |
| Adjusted homebuilding gross margin | $1,246,324 | 29.0% | $1,104,931 | 27.9% |
| Homebuilding gross margin percentage | 26.4% | 24.9% | ||
| Adjusted homebuilding gross margin percentage | 29.0% | 27.9% | ||
RECONCILIATION OF NON-GAAP FINANCIAL MEASURES (continued) (unaudited)
The following table reconciles the Company’s ratio of debt-to-capital to the non-GAAP ratio of net debt-to-net capital. We believe that the ratio of net debt-to-net capital is a relevant financial measure for management and investors to understand the leverage employed in our operations and as an indicator of the Company’s ability to obtain financing.
| December 31, 2022 | December 31, 2021 | |
| Loans payable | $287,427 | $250,504 |
| Senior notes | 1,090,624 | 1,087,219 |
| Total debt | 1,378,051 | 1,337,723 |
| Stockholders’ equity | 2,832,389 | 2,447,621 |
| Total capital | $4,210,440 | $3,785,344 |
| Ratio of debt-to-capital(1) | 32.7% | 35.3% |
| Total debt | $1,378,051 | $1,337,723 |
| Less: Cash and cash equivalents | (889,664) | (681,528) |
| Net debt | 488,387 | 656,195 |
| Stockholders’ equity | 2,832,389 | 2,447,621 |
| Net capital | $3,320,776 | $3,103,816 |
| Ratio of net debt-to-net capital(2) | 14.7% | 21.1% |
__________ (1) The ratio of debt-to-capital is computed as the quotient obtained by dividing debt by the sum of debt plus equity. (2) The ratio of net debt-to-net capital is computed as the quotient obtained by dividing net debt (which is debt less cash and cash equivalents) by the sum of net debt plus equity.
RECONCILIATION OF NON-GAAP FINANCIAL MEASURES (continued)
(unaudited)
The following table calculates the non-GAAP financial measures of EBITDA and Adjusted EBITDA and reconciles those amounts to net income available to common stockholders, as reported and prepared in accordance with GAAP. EBITDA means net income available to common stockholders before (a) interest expense, (b) expensing of previously capitalized interest included in costs of home sales, (c) income taxes and (d) depreciation and amortization. Adjusted EBITDA means EBITDA before (e) amortization of stock-based compensation and (f) real estate inventory impairments and lot option abandonments. Other companies may calculate EBITDA and Adjusted EBITDA (or similarly titled measures) differently. We believe EBITDA and Adjusted EBITDA are useful measures of the Company’s ability to service debt and obtain financing.
| Three Months Ended December 31, | Year Ended December 31, | |||
| 2022 | 2021 | 2022 | 2021 | |
| (in thousands) | ||||
| Net income available to common stockholders | $202,973 | $147,440 | $576,060 | $469,297 |
| Interest expense: | ||||
| Interest incurred | 35,294 | 24,766 | 124,529 | 92,783 |
| Interest capitalized | (35,294) | (24,766) | (124,529) | (92,783) |
| Amortization of interest in cost of sales | 38,042 | 23,991 | 106,681 | 101,448 |
| Provision for income taxes | 68,719 | 49,117 | 190,803 | 156,395 |
| Depreciation and amortization | 9,369 | 8,323 | 28,010 | 32,421 |
| EBITDA | 319,103 | 228,871 | 901,554 | 759,561 |
| Amortization of stock-based compensation | 2,040 | 8,369 | 18,780 | 20,941 |
| Real estate inventory impairments and lot option abandonments | 3,573 | 20,125 | 8,747 | 20,838 |
| Adjusted EBITDA | $324,716 | $257,365 | $929,081 | $801,340 |
More news
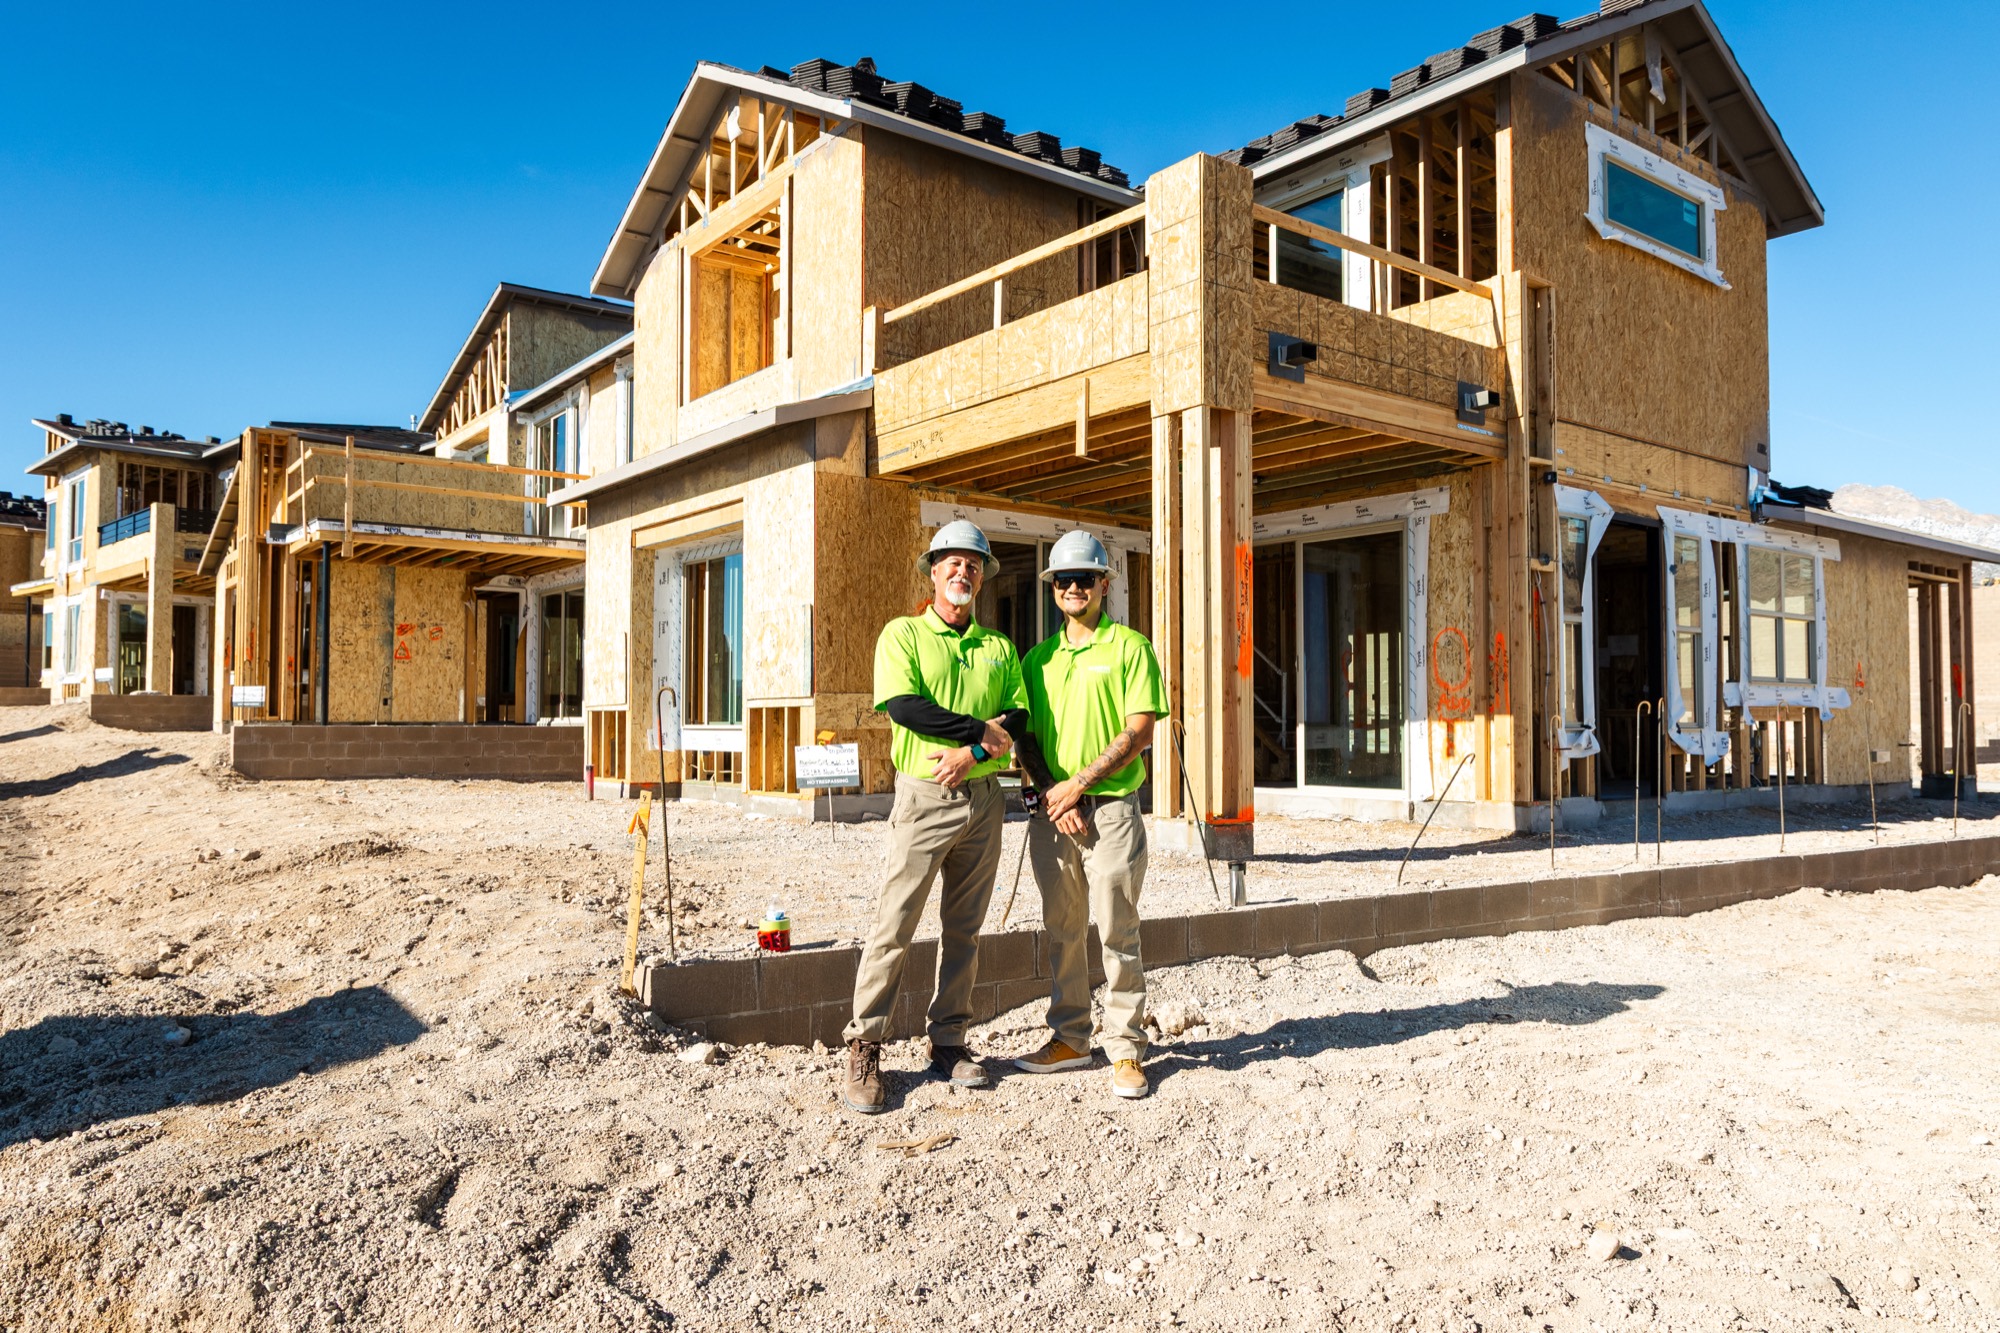
Tri Pointe Homes Named to Best Workplaces in Construction List by Great Place To Work and Fortune for the Fifth Consecutive Year
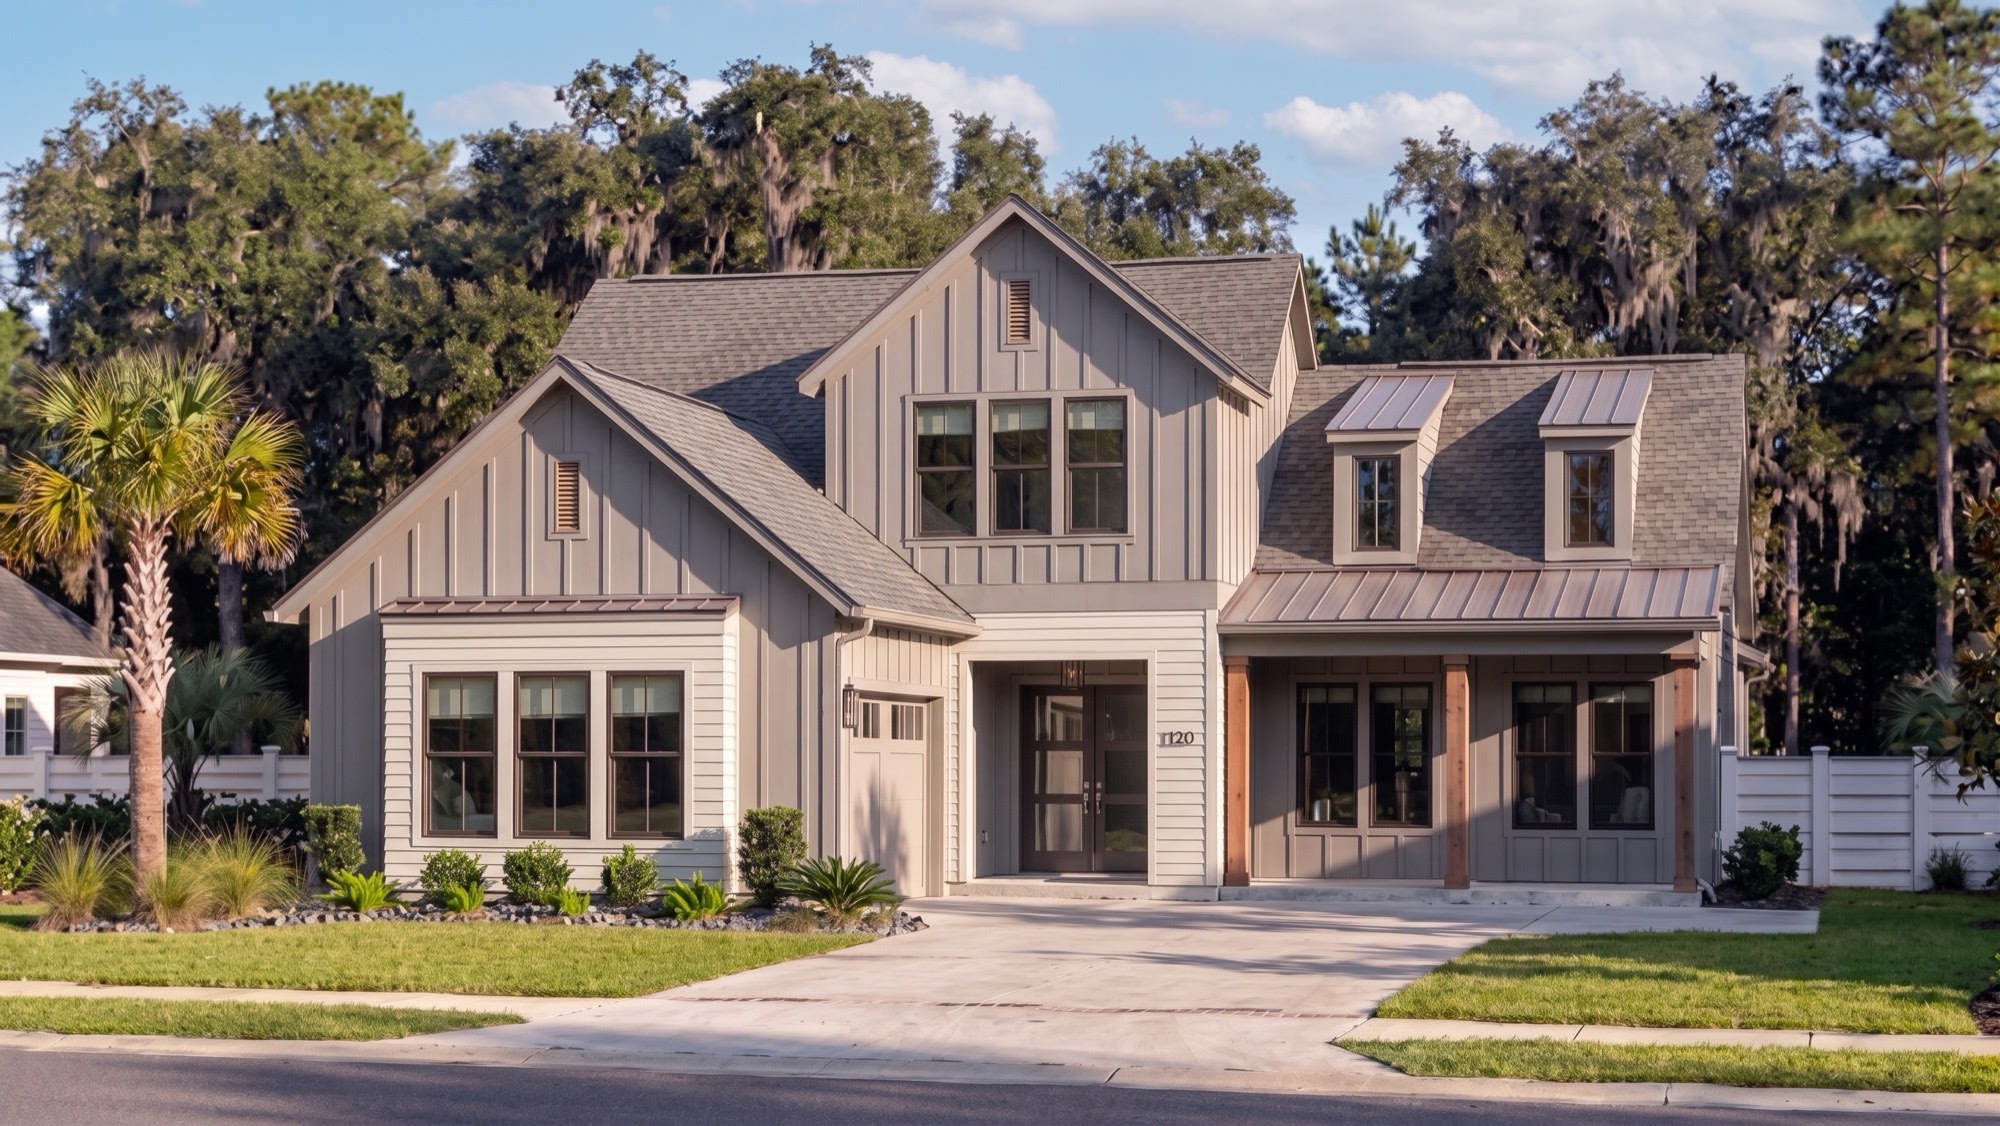
Tri Pointe Homes Acquires 60.4 Acres in Bluffton’s New Riverside Final Phase